
A warehouse can process thousands of operations in a single day while management still lacks a clear picture of where time is being lost, where errors occur or which resources are being used inefficiently.
Activity volume is not the same as performance. To improve logistics processes, they need to be measured using indicators that show not only how much work is being done, but also how quickly, how accurately and with what resources.
These indicators — warehouse KPIs, from Key Performance Indicators — transform daily warehouse events into information that can be compared, analysed and used in operational decision-making.
WERC – Warehousing Education and Research Council tracks dozens of metrics used in distribution centres through its annual DC Measures report, ranging from on-time shipments and dock-to-stock performance to warehouse capacity utilisation.
However, a warehouse does not become more efficient simply by monitoring more KPIs. What matters is measuring the right indicators for its own workflows and objectives. In a WMS system, this data can be collected directly from operational execution and transformed into comparable performance indicators.
What is a warehouse KPI?
A KPI is an indicator associated with an operational objective.
For example, the number of orders processed in a day is a metric. It becomes truly relevant to performance when compared with one or more factors such as:
- available time;
- number of operators;
- number of lines processed;
- error rate;
- shipping deadline;
- warehouse capacity.
If a warehouse processes more orders but its error rate increases significantly, higher volume does not automatically mean better performance.
This is why KPIs should be analysed together.
Speed without accuracy can generate errors.
Accuracy without productivity can generate costs.
High occupancy without available capacity can create bottlenecks.
An effective monitoring system must maintain a balance between these dimensions.
How should a warehouse KPI be defined?
Before building a dashboard, several elements should be clearly defined for each indicator:
- what is being measured;
- the calculation formula;
- the data source;
- the time period being analysed;
- the target value or acceptable threshold;
- the person or team responsible for the result.
Without a consistent definition, comparisons can become misleading.
For example, two warehouses may both use the term “picking productivity”, but one may calculate order lines per hour, while the other measures units picked per hour. Both measure productivity, but the results cannot be compared directly.
Which warehouse KPIs should you monitor?
There is no universal list that applies to every company.
A retail warehouse, an e-commerce fulfilment centre, a 3PL operator and a warehouse supporting manufacturing operations may have very different priorities.
However, several categories of indicators provide a useful overview of operational performance.
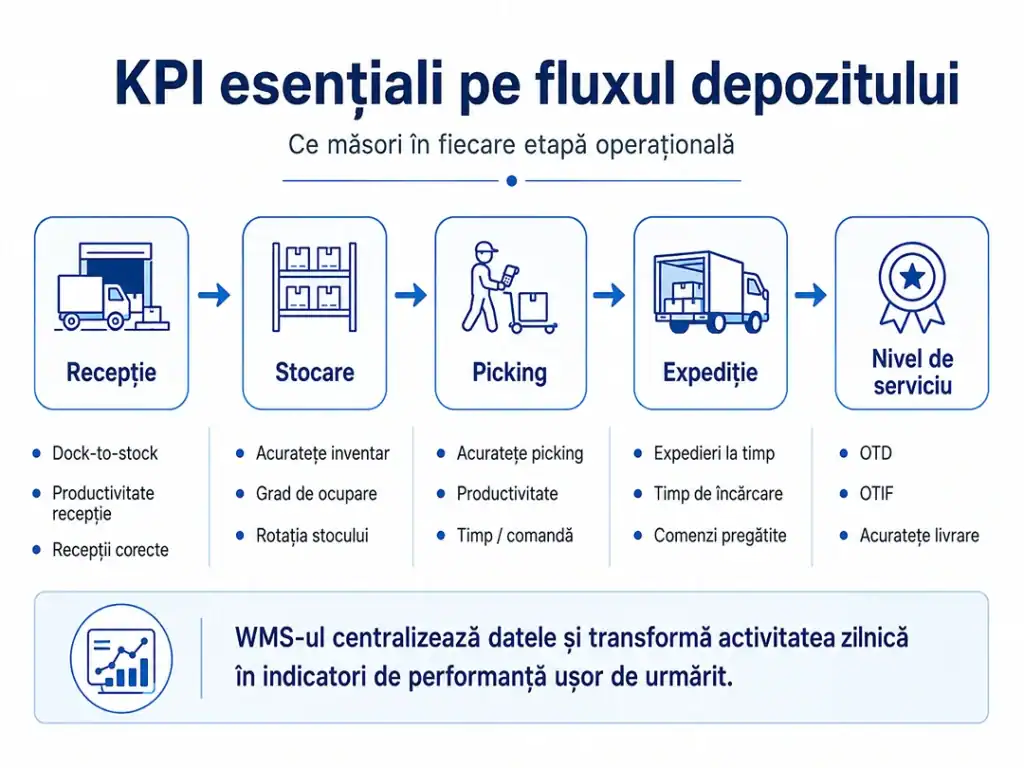
1. Dock-to-stock: how long does it take for goods to become available?
Dock-to-stock cycle time measures the time between the arrival of goods at receiving and the moment they have been received, checked, stored and made available for subsequent operations.
A simplified formula is:
Dock-to-stock = time inventory becomes available − time goods arrive at receiving
A high value may indicate bottlenecks caused by:
- manual checks;
- incomplete documents;
- slow receiving processes;
- quality control;
- labelling;
- lack of available locations;
- inefficient put-away.
The indicator shows that a delay exists, but does not explain its cause by itself. Intermediate events also need to be analysed in order to identify the underlying problem.
2. Receiving productivity
This KPI shows how much volume the receiving team can process within a given period of time.
Depending on the type of operation, it can be measured as:
Pallets received / hours worked
or
Lines received / hours worked
or
Units received / hours worked
There is no single correct unit of measurement for every warehouse.
In a warehouse where goods are predominantly received as full pallets, pallets per hour may be a relevant indicator. In a warehouse with many SKUs and fragmented receipts, the number of lines processed may better reflect the complexity of the activity.
3. Inventory accuracy
Inventory accuracy shows how closely the information in the system matches the physical reality in the warehouse.
One possible formula is:
Inventory accuracy (%) = locations without discrepancies / locations checked × 100
Depending on the company, the indicator can also be calculated at item, unit, batch or inventory-value level.
Inventory discrepancies may indicate problems such as:
- incorrectly recorded receipts;
- unconfirmed movements;
- incorrect picking;
- incompletely processed returns;
- products stored in the wrong location;
- operations performed outside the system.
Inventory accuracy is not merely an accounting indicator. It directly affects product availability and the warehouse’s ability to fulfil orders correctly.
4. Warehouse capacity utilisation
A warehouse should not be assessed solely by its total floor area, but by its actual usable capacity.
A simplified formula may be:
Capacity utilisation (%) = occupied locations / available locations × 100
Depending on the warehouse configuration, the calculation may use:
- pallet locations;
- cubic metres;
- usable floor area;
- locations by zone;
- capacity by storage type.
A very low occupancy rate may indicate inefficient use of space.
However, constantly operating close to 100% capacity does not necessarily represent good performance either. A lack of available space can make put-away, replenishment, movements and order consolidation more difficult.
For this reason, it is useful to monitor both average occupancy and peak capacity utilisation.
5. Picking accuracy
Picking is one of the processes where speed and quality need to be monitored simultaneously.
One possible formula is:
Picking accuracy (%) = lines picked without errors / total lines picked × 100
Errors may include:
- wrong item;
- wrong quantity;
- wrong batch;
- wrong serial number;
- product picked from the wrong location;
- incomplete order.
ASCM – Association for Supply Chain Management includes order accuracy, inventory turnover and other operational indicators among the KPIs relevant to evaluating warehouse efficiency.
Picking accuracy should, however, be analysed together with productivity. A process may be highly accurate but excessively slow, or very fast but prone to errors.
6. Picking productivity
Productivity may be measured as:
Order lines picked / productive hours
or
Units picked / productive hours
For a meaningful analysis, the complexity of the operation also needs to be taken into account.
Picking a full pallet is not equivalent to preparing an order containing dozens of different items spread across multiple warehouse locations.
For this reason, comparisons between operators, zones or shifts should only be made when the activities are sufficiently comparable.
A WMS provides an important advantage here: tasks and operations can be associated with the user, zone, execution time and activity type, creating a much stronger basis for productivity analysis.
7. Internal order processing time
This indicator measures how long an order actually spends within the warehouse’s operational flow.
A useful definition may be:
Internal order processing time = time the order is ready for shipping − time the order is released to the warehouse
This interval may include:
- inventory allocation;
- picking;
- required replenishment;
- consolidation;
- verification;
- packing;
- preparation for shipping.
Analysis of the total time should be supplemented with the duration of the intermediate stages. Otherwise, we know that an order took too long, but not where the delay occurred.
8. On-time shipments
This warehouse KPI shows the percentage of shipments that are prepared and dispatched within the planned time window.
On-time shipments (%) = shipments completed on time / total shipments × 100
It is an important indicator because it connects internal warehouse performance with the level of service provided to the customer.
Delays may be caused by:
- picking;
- inventory shortages;
- replenishment;
- consolidation;
- documents;
- lack of resources;
- loading;
- transportation.
This is why the KPI value should always be correlated with the reason for the delay.
9. OTIF – On Time In Full
OTIF checks two conditions simultaneously:
- the order is delivered on time;
- the order is delivered in full.
The general formula is:
OTIF (%) = orders delivered on time and in full / total orders × 100
OTIF is a highly valuable management indicator, but it must be interpreted correctly: it is not exclusively a warehouse KPI.
The result may also depend on:
- inventory availability;
- production;
- planning;
- transportation;
- suppliers;
- commercial data.
From this perspective, OTIF goes beyond warehouse performance and should be analysed within the wider context of Supply Chain Management processes.
The WMS can provide an important part of the required information, but calculating end-to-end performance may require WMS ERP integration, TMS integration or connections with other systems.
In Crosspoint, the KPI & Dashboards functionality within the WMS suite allows relevant indicators to be defined and monitored for each project, together with target values and accepted limits.
10. Inventory turnover
Inventory turnover indicates how many times average inventory is replaced during a given period.
A commonly used financial formula is:
Inventory turnover = cost of goods sold / average inventory value
A complete calculation generally requires financial information from the ERP, while the WMS provides important operational data concerning inventory movement, age and location.
Turnover analysis can also be useful at item or category level.
A slow-moving product may:
- occupy valuable locations;
- increase storage costs;
- create a risk of expiry or depreciation;
- generate unnecessary movements;
- reduce space utilisation efficiency.
For this reason, inventory turnover can also become an important criterion for slotting and product-location optimisation.
Outcome KPIs and KPIs that explain the outcome
One of the most common mistakes is to monitor only the final result.
For example:
OTIF = 94%
shows that there is a problem, but does not explain where the problem is.
To identify the cause, the analysis needs to move deeper into the workflow:
Low OTIF
↓
Delayed shipments
↓
Orders prepared late
↓
Slow picking
↓
Insufficient replenishment
↓
Inventory unavailable in the picking area
This is one reason why a useful dashboard should not contain management-level indicators alone.
It should allow the user to move from the result to the process that generated it.
How do you choose the right warehouse KPIs?
More indicators do not automatically mean greater control.
For an initial operational dashboard, a smaller group of KPIs covering different areas of activity is often more useful.
Receiving
- dock-to-stock;
- receiving productivity;
- receiving accuracy;
- waiting time.
Inventory
- inventory accuracy;
- occupancy rate;
- inventory turnover;
- inventory age;
- inventory discrepancies.
Picking
- picking accuracy;
- lines/hour;
- units/hour;
- average time per order.
Shipping
- orders prepared on time;
- on-time shipments;
- consolidation time;
- loading time.
Service level
- OTD;
- OTIF;
- delivery accuracy;
- returns caused by logistics errors.
Not all these values need to be displayed to every user at the same time.
The warehouse manager, a zone coordinator and company management require different levels of detail.
Why target values should not be copied mechanically from benchmarks
Benchmarks are useful as a reference, but they need to be interpreted in context.
Two warehouses may be similar in size and still operate in completely different ways:
- one ships full pallets, while another prepares thousands of e-commerce orders;
- one manages 500 SKUs, while another manages tens of thousands;
- one operates a single shift, while another runs 24/7;
- one handles standard products, while another tracks batches, serial numbers and expiry dates;
- one relies mainly on manual processes, while another uses automation.
For this reason, a value achieved in another warehouse should not automatically become a target for your own operation.
A more effective approach is:
Defining indicators and target values can form part of process analysis and WMS consulting, allowing KPIs to reflect the actual characteristics of the warehouse.
Initial measurement → baseline → identify causes → set target → intervene → measure again
The benchmark provides context. The evolution of your own warehouse shows whether optimisation is working.
From data to decisions: the role of a WMS
A warehouse continuously generates data.
Every receipt, scan, movement, picking task, inventory count, consolidation or shipment creates an operational event.
The problem arises when this information is scattered across spreadsheets, documents, standalone applications and manually generated reports.
A WMS can transform operational transactions into a coherent foundation for calculating and analysing performance indicators.
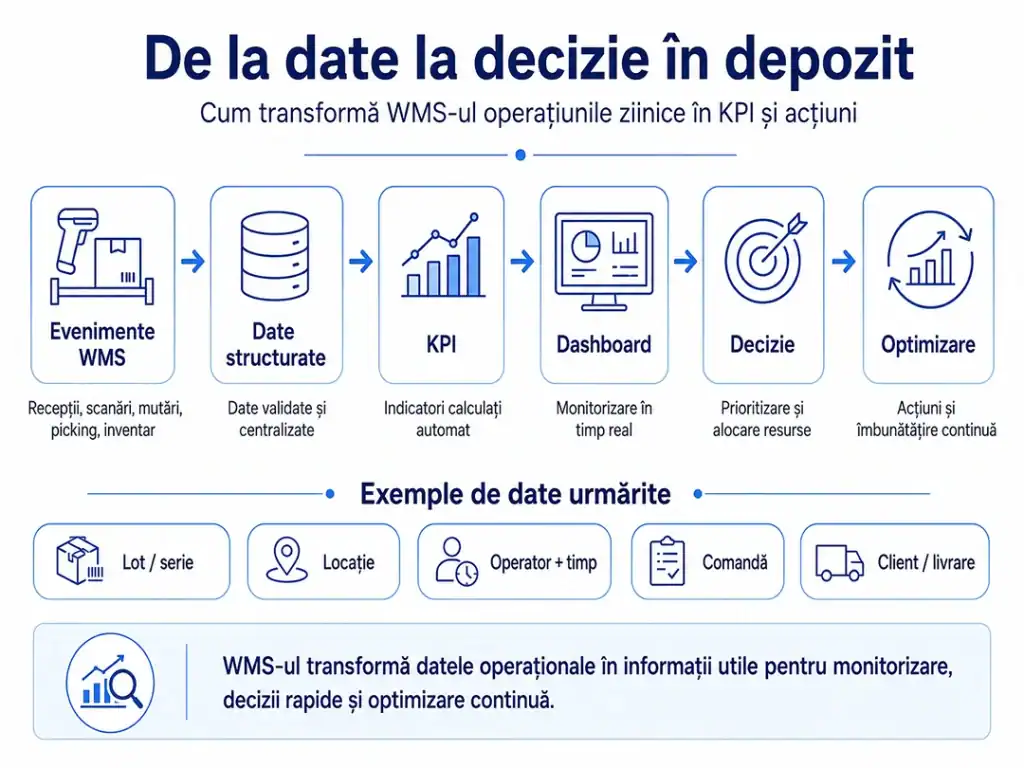
Crosspoint WMS allows relevant KPIs to be defined and monitored for each warehouse and logistics workflow. Depending on the project, indicators such as OTD, OTIF, inventory accuracy, inventory turnover, processing times, resource utilisation and operator productivity can be monitored.
Thresholds and objectives can be adapted to different warehouses, clients, workflows or categories of operations, while the information can be consolidated into dashboards and reports for performance analysis.
These capabilities are part of a broader approach to operational control and optimisation described on the page dedicated to the benefits of Crosspoint WMS.
A good dashboard should do more than report the past
A monthly report may show that productivity has declined.
An operational dashboard should make it possible to identify the problem early enough for management to intervene.
For example, if the volume of orders still waiting to be processed is too high compared with the remaining time and available resources, management can:
- reallocate operators;
- change priorities;
- redistribute tasks;
- identify the blocked area;
- investigate the cause of the delay.
The difference is important:
Reporting explains what happened.
Operational monitoring allows intervention in what is happening now.
Real example: measuring results after WMS implementation
A relevant example is the Crosspoint WMS implementation at Cris-Tim.
According to data published by Point Logistix, the investment in the system paid for itself in approximately 12 months, while project results included inventory accuracy of 99.95% and delivery accuracy of 99.83%.
These values are relevant not because they should become universal targets for every warehouse, but because they demonstrate the importance of measurable indicators when evaluating the outcome of an optimisation project.
A WMS project can be assessed far more objectively when there is a basis for comparison:
Initial situation → intervention → measurable result
More information is available in the Crosspoint WMS – Cris-Tim case study.
The most common mistakes when using warehouse KPIs
Too many indicators
A dashboard containing dozens of values can become harder to use than one that focuses on a smaller number of carefully selected indicators.
Every warehouse KPI should answer an operational question.
If a value does not lead to a decision or trigger an action, it is worth asking whether it needs to be monitored.
Changing formulas
If productivity is calculated one month using total working hours and the next month using only productive hours, the results are no longer comparable.
KPI definitions should be documented and kept consistent.
Comparing different processes
Two operators may produce very different results because they perform tasks with different levels of complexity.
A KPI should be interpreted in the context of:
- the zone;
- order type;
- products;
- equipment;
- shift;
- level of automation.
Optimising a single KPI
If operators are evaluated exclusively according to the number of picking lines per hour, behaviours may emerge that increase speed while reducing accuracy.
This is why indicators need to be balanced.
Productivity + accuracy is generally more meaningful than productivity analysed in isolation.
Incorrect data
A sophisticated dashboard cannot compensate for incorrectly recorded data.
If physical operations are not confirmed correctly in the system, the KPIs will describe a reality that differs from what is actually happening in the warehouse.
The quality of measurement begins with disciplined operational execution.
How can you check whether your warehouse KPIs are useful?
For each indicator used in the warehouse, try to answer the following questions:
- Which objective does it measure?
- What is the exact formula?
- Where does the data come from?
- How often is it updated?
- What is the normal value?
- What is the target value?
- At what value should an alert be triggered?
- Who should respond?
- What action can be taken?
- Can I identify the process that caused the deviation?
- Can I compare the result with previous periods?
If a KPI shows only a number but does not lead to an explanation or action, its usefulness is limited.
From warehouse measurement to continuous improvement
The purpose of KPIs is not to produce more reports.
Their purpose is to transform daily warehouse activity into a process that can be analysed and improved.
A healthy management cycle looks like this:
Measurement → identify deviation → analyse cause → intervene → measure again
In this way, warehouse KPIs help separate perception from operational reality.
The manager no longer has to assume that picking is slow, that receiving is creating bottlenecks or that the warehouse is too crowded. The data can show where the problem occurs, when it occurs and what impact it has.
A WMS completes this process by capturing operational events and transforming them into information that can be measured and analysed.
Do you want to measure warehouse performance more accurately?
Crosspoint WMS allows performance indicators, target values and accepted thresholds to be configured according to the workflows and objectives of each implementation.
Dashboards and reports can transform the data generated daily in the warehouse into useful information for operational control and optimisation decisions.